US Hyperscale Data Centers Used 82 TWh, 54% Fossil Power, Study Finds
A Nature Sustainability study of 403 US hyperscale data centers estimates 82 TWh and 25.7 Mt of CO2 from May 2024 to April 2025. Over half the power was fossil, concentrated in four states.
2 min read
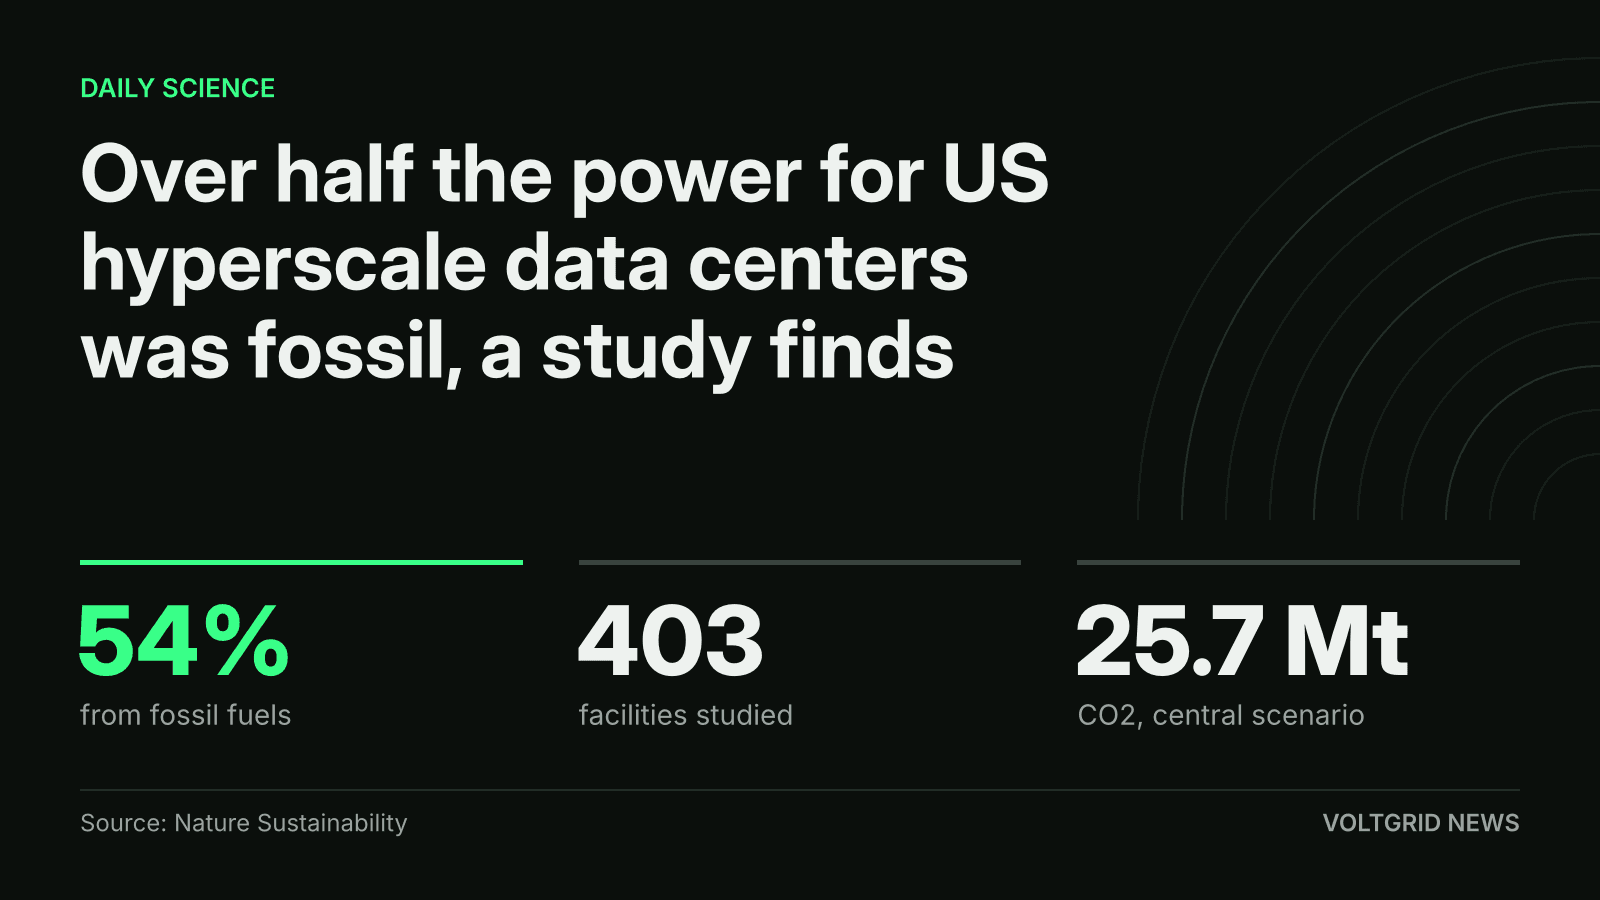
The study attributes about 54% of the electricity used by 403 US hyperscale data centers to fossil fuels, with about 25.7 Mt of CO2 in its central scenario.
Graphic: Voltgrid News
US hyperscale data centers used about 82 terawatt-hours (TWh) of electricity between May 2024 and April 2025, roughly 1.8% of US consumption, according to a Harvard study published Nov. 16 in Nature Sustainability.
The researchers, from Harvard's T.H. Chan School of Public Health and the Harvard Data Science Initiative, built a facility-by-facility estimate for 403 hyperscale sites. Their central scenario puts the associated carbon dioxide at about 25.7 million metric tons. Across all load scenarios, the paper gives a range of about 68-99 TWh and 21-31 million tons of CO2. Latitude Media likened the electricity use to Michigan's annual total and the emissions to Denmark's.
The central estimate is about 82 TWh, within a 68-99 TWh range across load scenarios, according to the Nature Sustainability study.
Graphic: Voltgrid News
Reuters reported that the 25.7 million tons is about three times the last peer-reviewed measurement, for 2018. Latitude Media put the gap at two to three times that earlier estimate.
Where Hyperscale Data Center Electricity Comes From
Roughly 54% of the electricity attributed to these data centers came from fossil fuels, the paper says. Reuters reported that most of the sites ran on gas. The data centers' average carbon intensity was about 314 grams of CO2 per kilowatt-hour, below the US total-output average of about 348 grams, so the sector is not dirtier than the average grid on that measure.
Location drives the result. Reuters reported that Virginia, Oregon, Ohio and Iowa alone account for over half of the electricity use studied. Latitude Media said about a quarter of demand sits in grid regions dirtier than the national average, and cited Energy Information Administration figures putting Ohio at roughly 80% fossil generation, with about 20% from coal.
What the Load Means for Grid Planning
For grid operators and investors, the study ties a load number to a fuel mix, region by region. A fossil-heavy supply behind a fast-growing load is the pattern behind the gas build-out; Voltgrid reported on one estimate of that in the BNEF analysis of data center gas plants.
The authors also released an online explorer, Never Just a Building. In Latitude Media's example, a hypothetical 100 MW campus in Loudoun County, Virginia, scores 76 on a scale where 0 is best and 100 is worst. Switching it to 24/7 clean power lowers the score to 54.
What Is Not Confirmed Yet
This is an estimate, not metered data. The facility-level inputs are restricted by a data-use agreement, so outside researchers cannot rerun the facility map, though the authors published code and state- and grid-region-level exports. The headline figures rest on a central assumption about how hard each facility runs, which is why the paper gives a range. Lead author Gianluca Guidi told Reuters the aim is transparency and a method the public can trust. The researchers said further work will examine the health effects of air pollution from data center power use, and no results have been published yet.
Sources
- 01US hyperscale data centers emit as much as Denmark, report saysReuterskelo.com
- 02Assessing the carbon emissions and energy consumption of US hyperscale data centresNature Sustainabilitynature.com
- 03Study: Hyperscale data centers now use nearly as much power as MichiganLatitude Medialatitudemedia.com
- Desk
- Science Desk
- Published
- Sources
- 3 cited